
Without understanding Pinterest Analytics, you're just throwing stuff at the wall to see what sticks.
…and you definitely shouldn't do that. Unless, of course, it's with spaghetti! 🍝
All food puns aside, this guide will help you make sense of Pinterest Analytics and turn that knowledge into action. Action that grows your Pinterest presence, drives traffic, and gets your Pins in front of the right people.
So, put away the calculator and close those spreadsheets. You don’t need to be a data expert to grasp the basics.
I’ll show you how to check your Pinterest Analytics straight from the platform and share tips to turn your data into growth. Along the way, I’ll even share insights from our own Pinterest strategy to show how simple, strategic changes can lead to sweet results.
How to check analytics on Pinterest 📈
Before getting to the numbers, make sure you have access to Pinterest Analytics.
You DO NEED a Pinterest Business account to see the analytics dashboard. If you don't already have one, setting one up is super simple. You can also use my step-by-step guide on how to create a Pinterest Business account to help you out.
Once your business account is set up, here’s how you can use the free Pinterest Analytics tool.
Discover Our Top 5 Tips for Optimizing your Pinterest Account
Sign UpChecking Pinterest Analytics on the computer
1. Log in to your Pinterest account (analytics.Pinterest.com).

2. Click the Pinterest hamburger menu in the top left corner. Then, click Analytics overview under the Analytics section.
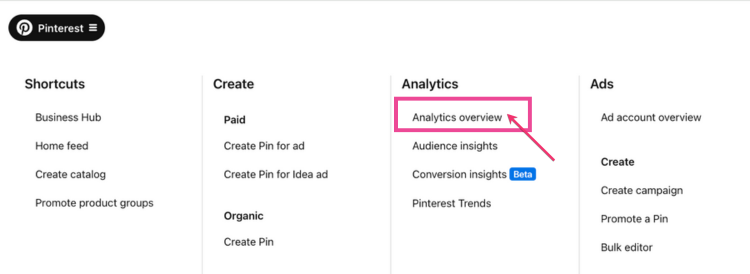
You'll automatically be taken to your Analytics Overview.
3. Explore those analytics.
Here, you'll see a snapshot of Pinterest stats over the past 30 days (which you can adjust).
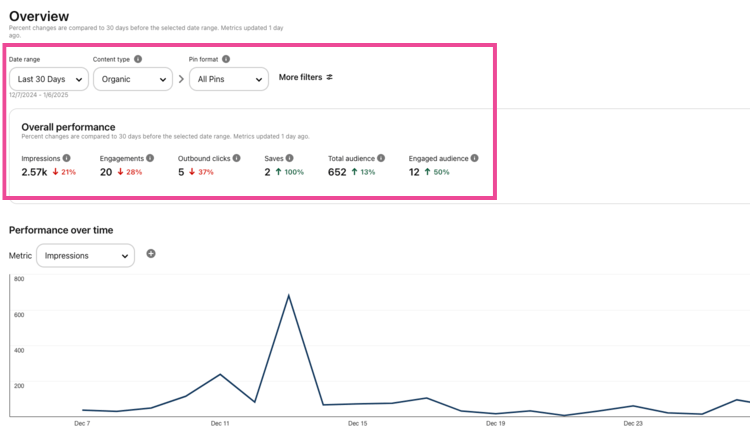
Want to compare how image, video, or product Pins perform? Use the filters in the Pin format dropdown to focus on specific content types.
From there, you can zero in on different metrics like Impressions, Engagements, Outbound clicks, and more. (More on this next!)
Then, when you scroll down the page, you'll see your Top product groups, Pins, and boards. (More on these later!)
Checking Pinterest Analytics from your phone
Want to stay on top of your Pinterest marketing strategy from your phone?
Here's how you can Pinterest Analytics reports right from the mobile app. ⬇️
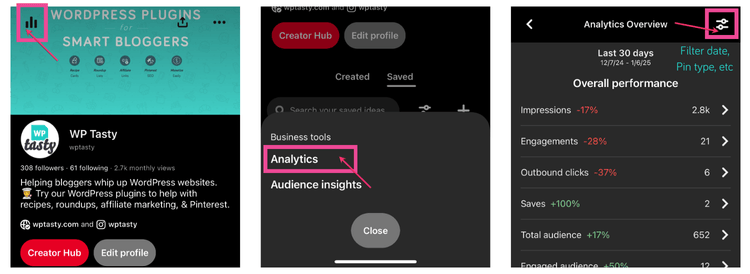
- Open the Pinterest App: Log in to Pinterest and tap your profile picture in the bottom-right corner.
- Go to Analytics: Tap the graph icon at the top of your profile.
- Tap Analytics from the dropdown. You'll see that 30-day overview and then, in the top right corner, filter between your metrics, date ranges, and more.
Now, let's get into what these numbers actually tell you. I'll break it down so you can turn those stats into strategies!
Understanding Pinterest Analytics
Impressions
Impressions are basically Pinterest’s version of views.
It’s the number of times your Pins have been shown to people, whether they clicked them, saved them, or just scrolled by.
For example, here’s a snapshot of our Impressions from the past 7 days.
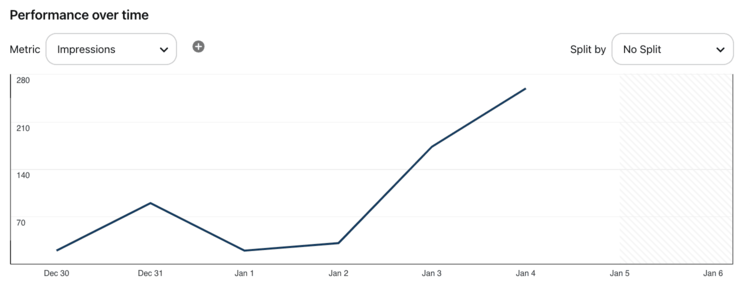
Our visibility started off small, but it’s picking up steam as we keep posting consistently and fine-tuning our Pins.
If you scroll down, you'll also see the Pins with the most Impressions.
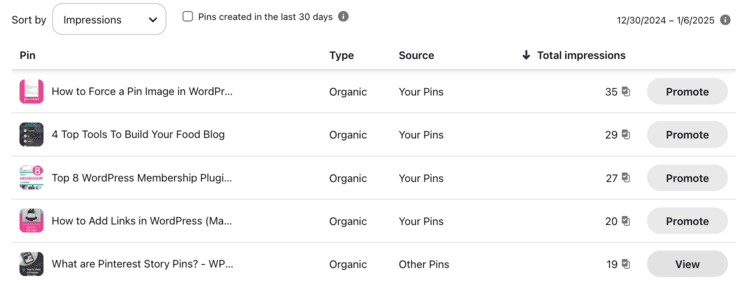
💡 When you analyze your Pinterest Impressions stats, keep an eye out for any trends. Is there a certain Pin type (i.e. story pin) or Pin topic (like a recipe) that’s doing really well? That means your content is on-trend, and people are searching for it.
You can even try resharing a high-impression Pin with small tweaks. Update the Pinterest description, change the Pin type, or test a fresh image to see if you can turn those views into clicks.
Saves
Saves refers to how many times your pin has been saved/repinned to another pinner's boards.
Each time someone saves your pin, it shows that they saw value in your pin. Plus, their followers will see that pin too. It’s a perfect way to gain more exposure for your blog!
Here's a Tasty tip: If you see a spike in saves around a certain time of year, narrow in on that date and see what pin was working well. Try replicating that same content type during the same time next year and see what happens!
You can also use my guide to getting more saves on Pinterest for extra help.
Engagements
Engagements give you a snapshot of how people are interacting with your Pins. This includes saves, close-ups, and outbound clicks. 🖱️
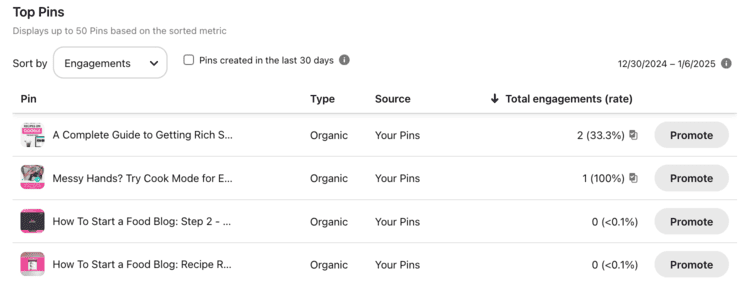
For example, one of our Pins with higher engagement over the past week has large, bold text and a clear message. That likely helped boost the engagement rate.
Still, I’ve noticed that our overall engagement is lower than we’d like.
Here’s what I'm doing to fix it:
- Posting more often: Sharing Pins more regularly so we stay in front of people.
- Simplifying designs: Making text and pictures easier to see.
- Improving the message: Writing Pinterest titles and descriptions that match what our audience is looking for.
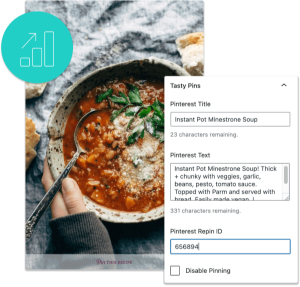
Interested in Tasty Pins?
Make Pinterest easy with Tasty Pins! Automatically optimize your blog images for Pinterest and control your pin titles and descriptions for more clicks.
Don’t forget about our 14-day money-back guarantee! Trying out Tasty Pins is risk-free!
Pin clicks
Pin clicks tell you how many times people clicked on your Pin to learn more This is a key metric for understanding how well your Pin is converting interest into action.
For example, here’s a look at our Pins sorted by clicks over the last 7 days.
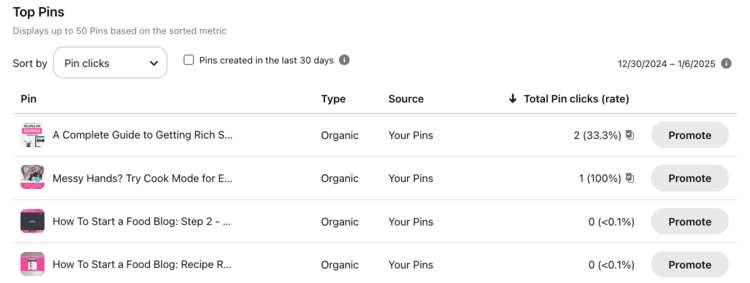
Some Pins stand out more than others. For instance, the Pin linking to my Guide to Rich Snippet Recipes had the highest click rate in the first week of this year.
Why? It was likely because of the bold text, clean design, and strong call to action that hit home with our audience.
Outbound clicks
Outbound clicks show the total number of times people clicked on your Pins to visit your website. This is the ultimate goal for bloggers.
Here’s a look at our Pins sorted by outbound clicks over the past 7 days:
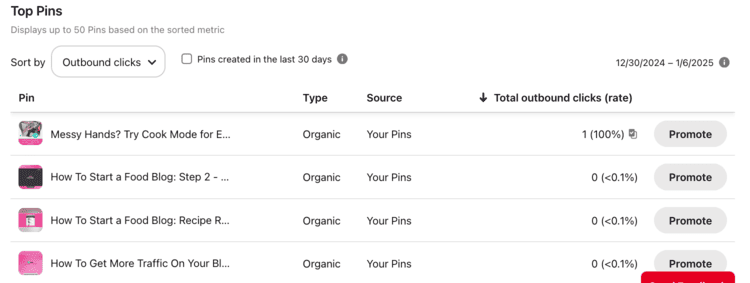
One of our Pins, “Messy Hands? Try Cook Mode for Easier Recipes,” had an outbound click this week. Why? It could be the title, a clear call to action, or simply that it addresses a problem people want to solve or know more about.
Pins with a high number of outbound clicks show you what your audience is really interested in, so you can create more content like it.
Want more tips on how to drive traffic from Pinterest? Check out my guide to getting more traffic from Pinterest for easy, actionable ways to grow.
Total audience & Engaged Audience
Pinterest splits your audience into two groups, your total audience and your engaged audience.
Your total Audience is the number of unique people who saw your Pins. Your engaged Audience is the number of unique people who interacted with your Pins (saves, clicks, or close-ups).
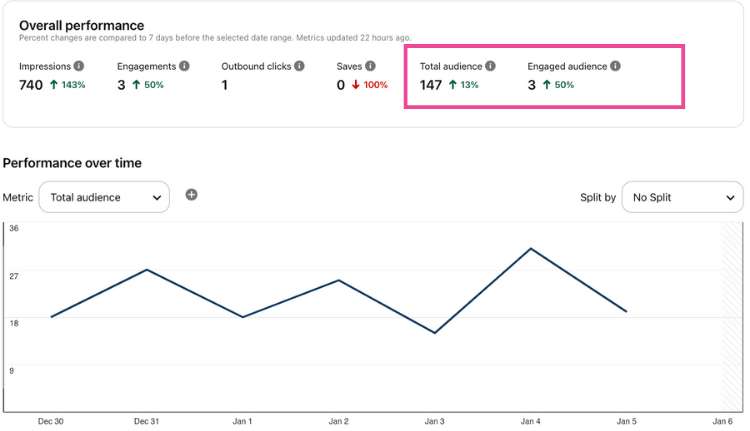
Over the past week, WP Tasty's Total Audience grew by 13%. That means more people are seeing our Pins. Even better, our Engaged Audience jumped 50%, showing that people are connecting with our content.
If your Total Audience is growing but your Engaged Audience isn’t, try some of these tweaks to better understand your audience:
- Create beautiful visuals with bold text and clear images.
- More compelling calls-to-action like descriptions that encourage saves or clicks.
- Testing new trending or seasonal content.
Let's say you have a holiday recipe that gets lots of views but few clicks. Try redesigning the Pin with a clearer message or a call to action inviting people to learn more.
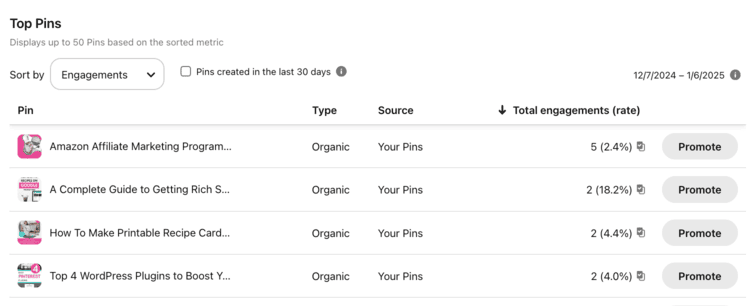
Top Pins & Top Boards
⭐️ Top Pins shows your best-performing Pins for a specific date range, not just the last 30 days.
You can filter this section by metrics like impressions, engagements, pin clicks, outbound clicks, and saves. To adjust the date range or metrics, just use the dropdown menus under “Overview” at the top of the page.
Here’s a look at some of our best Pins based on engagement.
⭐️ Top Boards highlights which of your boards are performing best.
This is an excellent way to see where your audience is spending the most time interacting with your content. If you notice certain boards performing better, focus on pinning more content to them. Boards that consistently get attention are great for building on.
Improve your Pinterest Analytics numbers with Tasty Pins

Now that you know how to read Pinterest Analytics, let’s talk about a tool that can help you grow even faster — Tasty Pins!
Tasty Pins is a WordPress Pinterest plugin that helps bloggers like you get the most out of Pinterest.
Here are a few ways Tasty Pins helps you improve your Pinterest performance:
- Use hidden images to include vertical, Pinterest-friendly pictures without cluttering your blog posts.
- Add Pinterest save buttons to your blog images so readers can save and share your Pin in a click.
- Add SEO-friendly Pinterest descriptions to your images right in WordPress
It gives you total control over your Pins so you can grow your saves, clicks, and traffic for Pinterest and your blog!
Want to know why else our users love Tasty Pins? Read more Tasty Pins testimonials.
Here’s what one of our awesome users, Samantha Carolan, loves about Tasty Pins.
Go check your Pinterest Analytics!
Once you understand your Pinterest numbers, they can help you niche down on that content your audience loves AND needs!
Metrics like impressions, saves, and the number of people interacting with your Pins show you what’s working and where to improve. Pair this knowledge with a tool like Tasty Pins to create an even easier connection between your blog and Pinterest!
Success on Pinterest is all about knowing what your audience loves and showing up for them, time after time.
Oh, and don’t forget to follow WP Tasty on Pinterest for even more blogging tips and inspiration!

